Pounce on the tm_kitco image from the data drive (lab2 subdirectory)- you will be using this for most of the lab. It's Landsat 5 TM imagery collected in August of 2000. I think. Note - this and the derivitive images will chew up a lot of space, keep an eye on disk space.
Just a quick note.. when dealing with earlier landsat imagery, we usually see 6 bands. Which, as collected is bands 1-5 and 7. 6 is technically the TIR band, while 5 and 7 are MIR. Band 7 was an afterthought..... However, whenever you see 6 band landsat 4-7, assume band 6 is really band 7, the second MIR band.
FILTERS
Mash the ' raster - spatial - convolution' button. In this popup you will see a gajillion different filter options - you can even make your own. Look through these to get an idea of what's there. If you want to see the exact kernel for the filter, hit the edit button (you will want to do this later). Note - often the results make more sense if you draw one band at a time (ie - band 1 in red, green, AND blue).
Run the low pass, edge detect, horizontal edge, vertical edge, and Laplacian filters (all 3x3). Look at the results - and compare them to the original landsat layers. Play around a bit. Be sure to zoom in and out of areas in which you find linear features which will be highlighted by the various edge filters (and not just in Ellensburg....). In short, look at multiple places! Especially those in which you think the filter will highlight what they're supposed to.
Q.1 What is the kernel (how it treats the 3x3 'hood) for each filter? Compare and contrast the results of the filters. When might the output for each be useful? I expect this question will chew up at least a page for the second and third parts). Be sure to describe specific places and how the filters altered things.
RATIOS
Now, mash the 'raster - unsupervised - indices' button. This gets you in the 'play with ratios' page. Also known as indices. Make sure you have the correct sensor chosen. Look through the options for the different indices and their formulae.
On the kitco image, run the NDVI, Iron Oxide, and Clay Mineral ratios.
Q. 2 Take a look at the output (the output is only 1 band). What do they appear to be mapping (as opposed to what they should be mapping - IF there's a difference)? Give me a paragraph or two discussing the output from each. Remember, for example, a NDVI will not show veg in areas where there is no veg... Just as the others won't show anything if covered in dense veg.
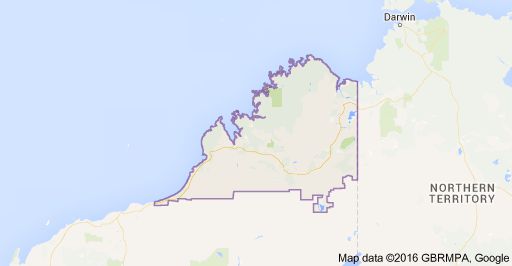
Next - we play with a little Aussie imagery. In this part, we will be working with a Landsat TM 4/5 dataset collected over north-western Western Australia (the Kimberley). It is a very dry region. The imagery isn't georeferenced, but it is somewhere in this region (I couldn't find the specific spot with a quick look on Google Earth. If one of you does, let me know. It's worth 1% of extra credit to the first person to ID the spot to me.):
Start by swooping onto the data which is in the lab7 subdirectory.
Examine the area in, first, a false colour image (3,2,1). Then as a colour IR (4,3,2) image. This is just to get a bit of familiarity with the area. Obviously, it's an area with folded sedimentary rocks, a number of faults, riparian veg, and (spoiler alert) recent burn scars.
Q.3) Vegetation is shown quite clearly in the colour IR image. Why would this knowledge be useful to a geologist or geomorphologist? In short, tell me why the veg is where it is and how that relates to the geology.
------------------------------------------------------------------------------------------------------------
Redraw the image using bands 7 (listed as band 6), 5, and 1.
Q.4) Compare and contrast the false colour and 751 images. Where is 751
a superior image for geologic interpretation. What about the colour IR image?
------------------------------------------------------------------------------------------------------------
Now, let's look at a few ratio images. To generate these, you will goto raster - unsupervised - indices. Run the following:
Q.3) what features should each image highlight (as a result of the ratio)? In other words, given what you know about what the different bands tend to be good at identifying (high or low R), what do you think these ratios are designed to highlight? However, what is it that they seem to be highlighting on these particular images?